Custom smartphone apps for Android and iOS
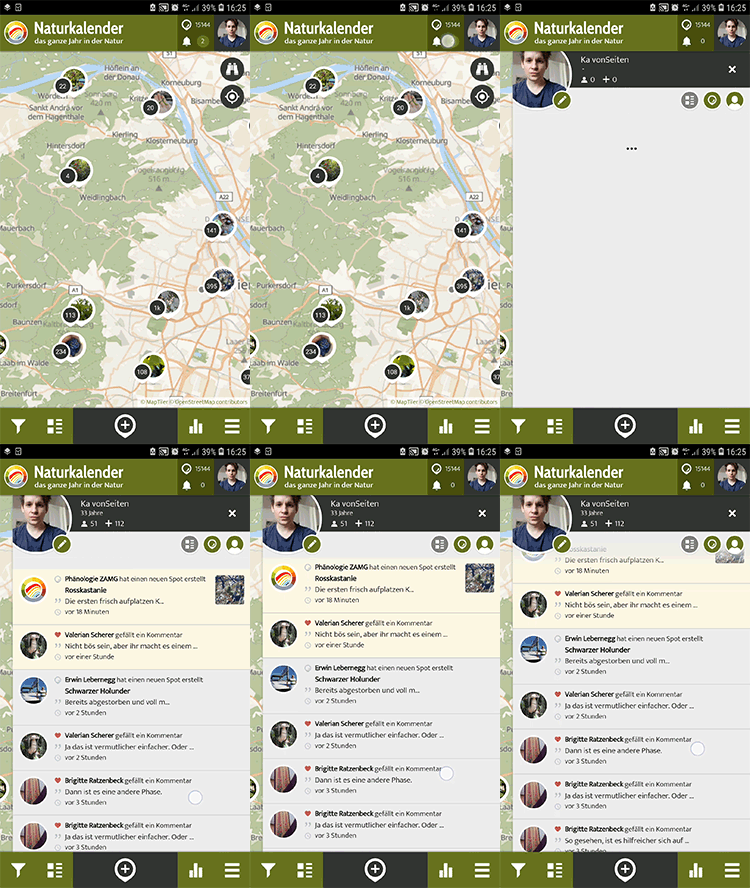
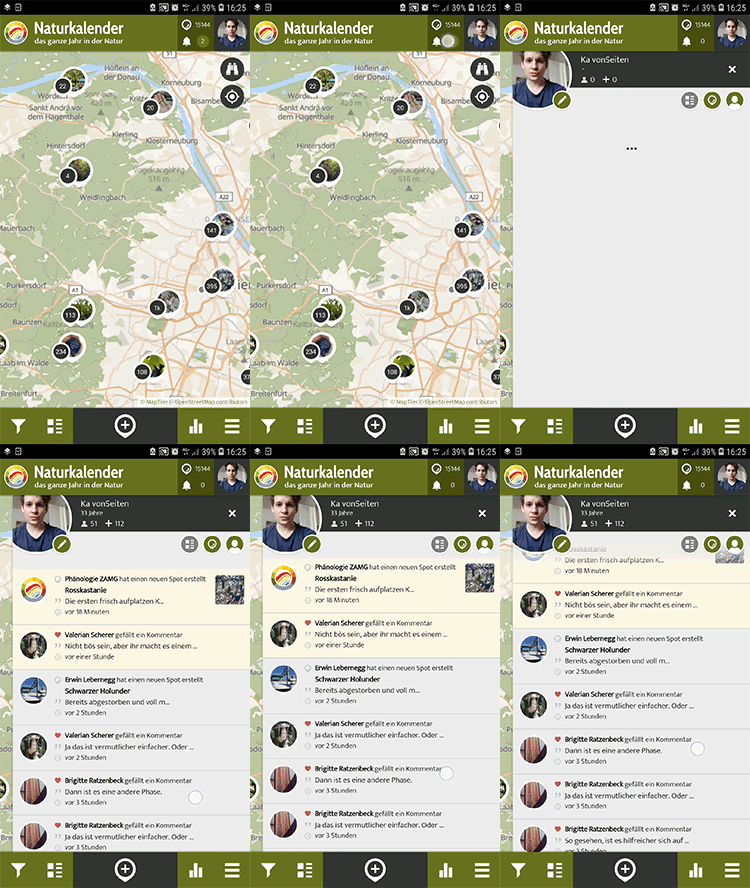
Custom smartphone apps for both Android and iOS are designed individually for projects and made available in the relevant stores. The design process also includes support, experience and expertise brought to the table in the process leading there, when projects need to come up with questionnaire structure and other structures.

Store setup with all necessary assets
We will take care of getting your apps into the Android and Apple App store, including all assets necessary. This includes the icons, image teasers and more, which we design exclusively for your project.
Custom app icon design with logo and project identity
Web-App: interactive map, embeddable in own homepage
You will be able to embed the interactive map from the apps in your own homepage. This web-app will also allow entering data directly via a browser.
Regular app updates for compatibility, stability and security
We will take care of regular app updates for compatibility, stability and security. This also means that we add new features of other projects in your apps.

EU GDPR compliance
Since SPOTTERON as a platform takes the role of "controller" - not just "processor" - for all user & community-based aspects, you don't have to worry about GDPR compliance. We will take care of it, so you don't have to worry about losing data if a user decides to delete his/her account.
Custom dialog for adding observations
Every project on the platform gets a custom structured "add spot" dialogue (Data Entry Page). The "add spot" dialogue is designed in collaboration with the project leaders to visualize the questionnaire structure. This data entry page includes individual buttons, multiple selection lists, a foto upload field and a field for further descriptions. If desired, info panels can be integrated into the selection lists to give additional information and ensure high data quality.
Offline mode with automatic waiting queue
The apps can also be used in offline mode. This means that observations can be collected while out in the field when no internet connection is available. These observations are then added to the waiting queue and can later be uploaded or modified.
Optimized for outdoor field use
All apps we create for you and your project, are designed for easy out of pocket (possibly offline) use with one hand so that collecting observations will be as simple and easy as possible for the Citizen Scientists contributing to your project.
App Intro slides for introduction, information and how-to tipps
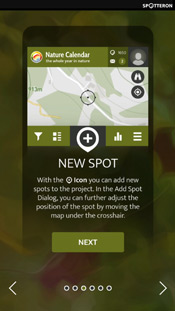
The app intro slides are displayed the first time of using the apps. The intro slides introduce the project to users and give them some background information and/or tips on how to use the app. Displaying of the app intro slides can be repeated by users by selecting 'replay intro' in the menu at any time. Additional slides for the intro can be designed and added to the project's intro slides if desired.
Unlimited data hosting on high performance server cloud
No worries about data hosting: We also provide you with unlimited data hosting on a high-performance server cloud.
SSL / TLS encryption for all sensitive data transfer
We make sure your data stays safe: All sensitive data transfer is SSL/TLS encrypted.
High quality design and look & feel
The design of an app is crucial for its success. Because we have a lot of experience in both the general field of design and app design, in particular, you are in good hands with us, to provide your apps and project with a high-quality design, look and feel.
Dynamic observation lists
In the apps, you will also find dynamic observation lists, which means that new observations come up in these lists as soon as they're added.
Dynamic observation counter
There's a constant observation counter in your apps. This allows both you and your users to keep track of how many observations have been collected so far.
Display meta information in selection lists (e.g. latin species names below common names)
You can display useful metadata in your selection lists (e.g. Latin species names below the common names) to provide your users with more information and also help them in determining their observation.
Image Editor for photos and image uploads with option for custom “sticker” placement by multitouch input (scale, rotate, position)
There's an image editor for photos and image uploads included in your apps. If needed, we can integrate an option for a custom "sticker" placement by multitouch input (scale, rotate, position), so that users can add these stickers for example as measuring tools, etc.
Stacking for Map Markers for high performance and usability
"Stacking" for map markers (a.k.a. observations) means that only stacks of high numbers of map markers will be displayed until zoomed into the map. Thereby we ensure high performance and usability because individual map markers will only be downloaded if explicitely desired.
Display observations as “featured” in the map with a highlight icon (TopSpots)
You can mark certain spots as "featured" in the map with a highlight icon (a.k.a. Top Spots) to show users updating this spot is especially valuable data for example, but also other purposes.
Filter for dynamic map display of observations
You (or your app users) can filter the map for a dynamic display of observations, according to a specific time frame, the category of observations or top spots, for example.
Update mode: users can add new observations to the same location
The update mode allows users to add new data in a location where data has already been collected. Thereby you can collect valuable data over time, which shows the development of an observed object, plant, etc.
Statistic panels per spot for charts display based on observation values
For spots with updates, the statistics panel shows the observation value development over time through chart displays. This visualization of data can be shown for different time frames like a week, month, quarter or even year.
Multi language ready
All apps are multi-language ready. Two languages are always included in the app setup, but we can add as many as you need as long as you provide us with the translations.
Custom information panel with media elements
Every project's app and an interactive map includes an information area for content like the project description, information about the topics of observations, media elements (pictures, graphics, link to online videos) and more. The information panel's content is working even without an internet connection and is always accessible.
Top user ranking list
Another feature included in your apps: Top user ranking. You and your users can see which 10 users collected most data. This way, you can thank diligent users for contributing, and other users will be encouraged to collect more data.
Partner and Sponsor Branding Options
Of course, we have different options available for you to brand your apps with your project identity and (in case this applies) also with sponsor logos.
Privacy first: no user tracking
We value privacy! That's why there is no form of user tracking involved in the use of any phone or web-based SPOTTERON apps.


